Monitoring our monitoring

Max Rozen / Published: March 08, 2023
Last Saturday, our API went down. Not even a funny error message or slightly slower responses either, it just completely vanished off the internet for 18 minutes.
I'm not normally one to point fingers at my hosting provider when things go wrong (since ultimately, I chose to use them, so it's my problem to fix), but when fly.io publicly posts on their forums about their reliability issues, I may as well link to them.
That being said, my fix was "simple": our monitoring is multi-region and multi-cloud, our API can be too.
Since I use Cloudflare Workers in front of everything, I started using a Worker as a sort of load-balancer to send traffic to different providers, in the hope that it'll be more resilient in case of an individual host suffering another outage.
Suddenly, false-positives
Around the same time, I noticed the number of email alerts OnlineOrNot was sending was a bit high.
On a bad day, we'll send out maybe 300 emails. On Saturday, we sent out 4900.
This Saturday morning, I rolled out a change to OnlineOrNot to migrate from a system that checks from a single region by default (us-east), to one that checks around the world (us-east -> eu-west -> south-east asia -> us-west) significantly more frequently (up to every 30 seconds for paid plans).
As part of this change, a bad deployment to Singapore resulted in elevated error alerts for almost all of our uptime checks from Singapore. At first I tried finding another region that wasn't having reliability issues, before just rolling back the change entirely.
What I did about it
This weekend made me realize I didn't have a reliable way of knowing when OnlineOrNot's own monitoring was having issues. While OnlineOrNot does use OnlineOrNot to monitor OnlineOrNot quite successfully, it only covers its web presence (marketing website, web app, API), and not the services running the system.
Instead, I would rely on a live-tail of the logs to see how things were going (essentially, vibes-based monitoring), and for two years that worked quite well! I also have a sort of "deadman's switch" to automatically change hosting provider running the uptime checks in the case of total outage, but that didn't help here.
To start with, I've started storing the results of each check in Clickhouse and built a Grafana dashboard for a live view of the system:
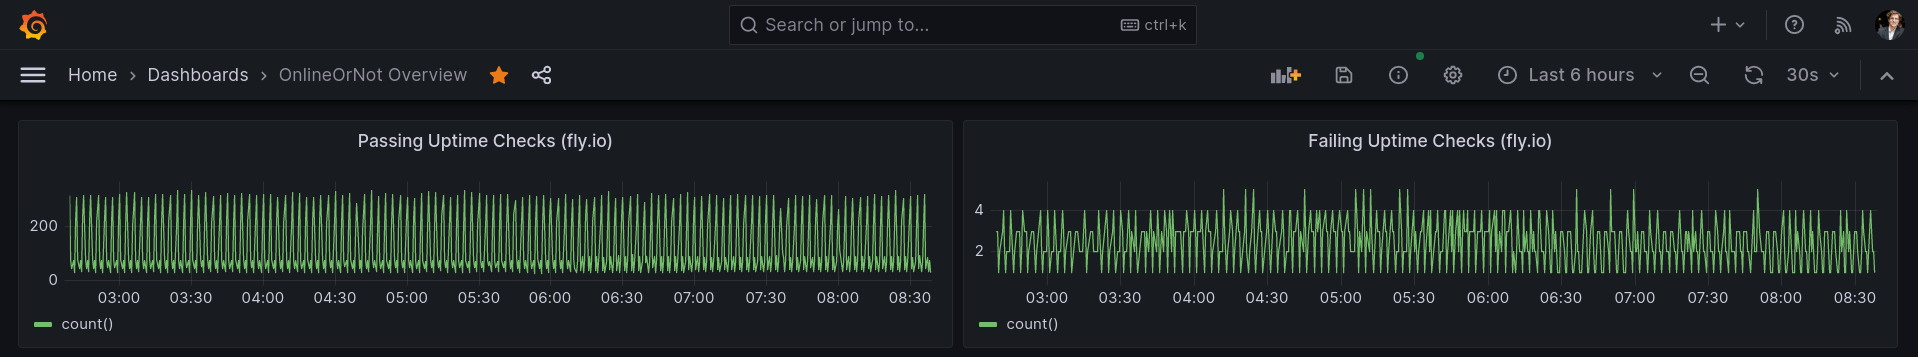
While it doesn't sound like much, this sudden visibility into how the system is running (live) gives me the confidence to make improvements I wouldn't otherwise be able to make, such as quadrupling uptime check concurrency on a single VM, and tweaking default timeouts and retries to reduce false positives.
We also have distributed tracing in other parts of the system (status pages), which I'll be adding to the uptime check system to get a bit more of a detailed view into how each check runs (more than just console.log, at least).