Understanding the Page Speed Metrics in Google Lighthouse

If your experience is anything like mine, you're probably pretty confused about all the acronyms involved in checking your page speed.
Chances are you probably also want to know which metrics matter, and if your score is good or bad.
Table of Contents
Metrics in a Google Lighthouse report
As an example, let's check out the performance section of a Google Lighthouse v7.3.0 report:
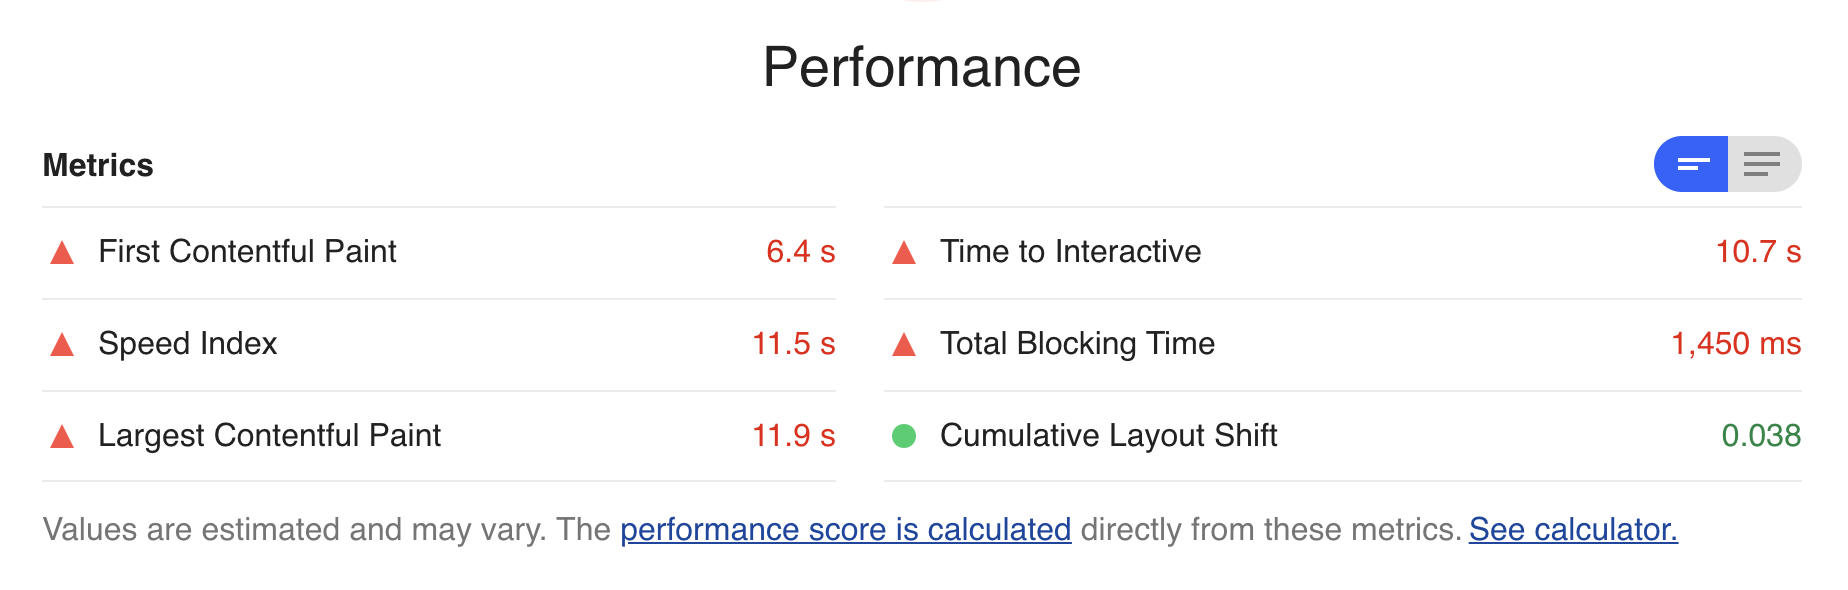
It helps to think of page speed metrics in a few categories:
- How long did the server take to start sending the page
- Time to First Byte (TTFB), or Server Response Time falls under this category
- How long did it take for the page to show certain things on the page
- First Contentful Paint (FCP), Speed Index, and Largest Contentful Paint (LCP) fall under this category
- How long did it take for the page to start responding to user interactions
- Time to Interactive (TTI) and Total Blocking Time (TBT) fall under this category
What do all of these metrics even measure?
What is Time to First Byte (TTFB)?
Time to First Byte measures the time between requesting a page, and getting the first byte of data back from a server. Time to First Byte used to be featured as a main metric tracked by Google Lighthouse. In more recent versions, it's featured as an audit named "Reduce initial server response time".
Google considers values greater than 600ms to be bad.
Some people don't worry as much about this metric since they believe that they can't influence it, but that's not necessarily true.
There are two places you can fix your TTFB:
Time spent on the server
Your backend server does have some influence on TTFB, with the main contributors being server-side rendering, database queries, API calls, load balancing, your actual app's code, the server's load itself (particularly if you're using cheap shared hosting).
You can improve your TTFB on your server by:
- Upgrading your server's specs (more RAM, more CPU), or paying more for a better hosting provider
- Upgrading your database's specs (assuming it's on a different server to your app server)
- Optimizing your backend code
Time spent being transmitted
The time spent transferring data from the server to the browser is often overlooked, but there are some easy wins here.
If you're not using a CDN, every request to your website (including images, CSS and JavaScript), gets routed across the world to your server.
As mentioned in Ten Ways to Improve WordPress Page Speed, using a CDN gives you hundreds of little servers across the world close to your users, that massively reduce the time it takes to load your page.
What is First Contentful Paint (FCP)?
First Contentful Paint measures the time it takes the browser to load the first visible block of text, or image on your page.
Google considers FCP values of:
- less than 2 seconds as fast
- greater than 2 seconds, but less than 4 seconds as moderate
- greater than 4 seconds as slow
If you have a particularly high FCP value, it might be worth double checking how fonts load on your page. You want to ensure your text is visible while your fonts load to minimize FCP.
What is Speed Index?
Speed Index measures how quickly visible content loads over time. As a metric, it rewards pages that provide a good user experience (that is, show visible content as soon as possible), and punishes pages that download all of their JavaScript and CSS before displaying anything.
Essentially this metric penalizes websites that load just a header and footer, then take 10 seconds to load content, while rewarding sites that load all content gradually over the same period of time.
As a user, you typically visit a webpage because you want to see its content. Visiting a website that loads its content slowly is generally a frustrating experience, and we're more likely to abandon a page that takes ages to show anything.
Google considers Speed Index values of:
- less than 4.3 seconds as fast
- greater than 4.3 seconds, but less than 5.8 seconds as moderate
- greater than 5.8 seconds as slow
What is Largest Contentful Paint (LCP)?
In contrast with FCP, Largest Contentful Paint measures the time it takes the browser to load the largest visible block of text, or image on your page.
This metric can be dramatically different between mobile and desktop, depending on how much content you show when the page first loads.
Google considers LCP values of:
- less than 2.5 seconds as fast
- greater than 2.5 seconds, but less than 4 seconds as moderate
- greater than 4 seconds as slow
What is Time to Interactive (TTI)?
Time to Interactive measures the time it takes for a webpage to be fully interactive, which Google defines as:
- The page displays content
- Event handlers are registered for most visible elements on the page
- User interactions are responded to within 50ms
TTI penalizes pages that optimize for content visibility at the expense of interactivity. That is, you can see the content, but you can't scroll or clicking on things has no effect.
Sites with slow TTI often use Server-Side Rendering (SSR) - a page is sent to the user with complete HTML and CSS, but effectively no scripts. It looks loaded, but actually isn't - not until we finish downloading jQuery, and 2.5MB of other JavaScript dependencies.
Google considers TTI values of:
- less than 3.8 seconds as fast
- greater than 3.9 seconds, but less than 7.3 seconds as moderate
- greater than 7.3 seconds as slow